We build revenue-generating infrastructure for category leaders.

Transform scattered marketing efforts into compounding systems — built custom, owned by you, engineered to scale.

Your competitors are still running campaigns. Category leaders run infrastructure. The difference compounds every quarter.

Infrastructure results — at a glance

Average revenue increase, full deployment
More qualified leads from existing traffic
Organic traffic growth, no paid dependency
100% Client-owned. Zero platform lock-in.
183% Average revenue growth on full infrastructure deployment
5x More qualified leads generated from existing traffic
$264 LTV improvement from $87 — no additional headcount
25hrs Founder time reclaimed per week through automation
What we build

Level up your revenue, improve marketing ROI

Three infrastructure systems designed specifically for niche CPG brands (by founders and creators). Not templates, not campaigns — engineered systems your brand owns outright, permanently.

System 01

Lead Generation
& Conversion

Become the category leader your buyers find first — and convert them with precision, not luck.

Your website traffic means nothing if it disappears into the ether. You're spending on ads that attract curiosity but not commitment. Your sales team is chasing leads that never close. And you have no reliable way to know which marketing dollars are actually working.

Our system doesn't just capture emails. It captures intent. Through behavioural tracking that identifies purchase signals, automated nurture sequences that speak to specific personas, and AI-powered lead scoring that tells your team exactly who deserves their attention right now.

You stop guessing. You start engineering.

The result?

  • 5–15× more qualified leads from existing traffic
  • 200–400% conversion rate increases
  • Sales cycles compressed by 40–60%
  • Full attribution — every dollar accounted for

Infrastructure investment

$15,000 + performance-aligned partnership

Timeline to revenue impact: 60–90 days

View Related Case Study

Rootwell Adaptogens' Match With the Right Leads

This case study is derived from an actual client account, however, due to our NDA (Non-Disclosure Agreement) obligations to our clients, we have used various methods to conceal information that might make it easier for a competitor to spot. For instance, instead of using exact figures, we use ranges. Instead of adding the actual markets they trade in, we substitute them for similar markets. All figures represent our proprietary frameworks, and documented performance ranges for comparable implementations. This creates a fair balance, where we can showcase the results of our solution(s), without compromising nor undermining the competitive advantage of our client.

The Brand

brand image

Rootwell Adaptogens is a mid-sized American supplement brand specialising in science-backed adaptogenic formulations. Founded in 2021, they sell direct-to-consumer through their own Shopify store and through select wellness retailers in South Africa, the UK, and Australia.Their product line includes four core SKUs: an ashwagandha-based stress recovery complex, a rhodiola-L-theanine focus formula, a cordyceps-ginseng energy blend, and a multi-adaptogen daily wellness stack. Average order value sits at $65 (approximately £49.12), with a product margin of 68%.

Annual Revenue

• Approximately $1.4 million.
• Estimated 60% through DTC channel.

Team

• The founder-CEO.
• A part-time marketing coordinator.
• A small outsourced fulfilment operation.
No dedicated sales team. No marketing automation infrastructure.

The Challenge

Rootwell's growth has been organic, literally. Word of mouth, a modest Instagram following (12,000 followers), and a few podcast sponsorships have carried them to their current revenue. But they've hit a ceiling. Here's what their data revealed during our Phase 1 audit:

Traffic without conversion

Their website received approximately 18,000 unique visitors per month. Their conversion rate (visitor to email subscriber) at the time was 1.2%, and their visitor-to-purchase rate was 0.8%. Both figures were below the supplement industry median of 2.1% and 1.4% respectively. That meant that roughly 17,700 visitors left every month without the brand capturing any means of re-engagement.

No lead capture infrastructure

There was no lead magnet, no pop-up, no exit intent mechanism, no quiz, no content gate. The only email capture point is a footer newsletter signup with a generic "Subscribe for updates" prompt — the lowest-converting capture format in e-commerce.

Blind spot on buyer behaviour

Google Analytics was installed but not configured beyond the default settings. No custom events, no enhanced e-commerce tracking, no goal funnels, no audience segments. The brand had no visibility into which pages drive consideration, where drop-off occurs, or what content correlates with purchase.

No nurture system

Email marketing consisted of monthly promotional blasts sent to the entire subscriber list (approximately 2,400 contacts at the time). No segmentation, no automation, no behavioural triggers. Open rates averaged 16% — below the health and wellness industry benchmark of 21% — suggesting list fatigue and irrelevance.

Manual, unscalable sales process

When a potential stockist or high-value customer enquired, the founder would respond personally. There was no lead scoring, no qualification process, and no system to distinguish a casual browser from a high-intent prospect ready to purchase.

The Core Problem

It's not that Rootwell lacks demand. It's that they have no system for capturing, qualifying, nurturing, and converting the demand that already exists. They were running a business that could convert 5–10x more of its existing traffic with the right infrastructure.

What We built

Our approach followed the three-phase methodology documented in our Intelligent Lead Generation & Conversion Engine fulfillment framework. Here's exactly what that looked like for Rootwell:

Phase 1: Foundation Setup (Weeks 1-2)
1.1 Customer Avatar Development

Before building anything, we needed to know who we were building for. The marketing automation specialist went on to conduct a full quantitative and qualitative analysis of Rootwell's existing customer base. The results we received:

Quantitative analysis involved pulling the last 12 months of Shopify transaction data, Google Analytics behaviour data, and email engagement metrics. We built pivot tables segmenting customers by age range, geographic distribution, purchase frequency, average order value, and product preference. For a brand like Rootwell, we expected to find 3–4 distinct buyer clusters.

Qualitative research involved interviewing 10–15 existing customers across segments — using a 15-question interview framework covering pain points, decision-making process, objections, preferred communication channels, and purchase triggers. The interviews revealed the why behind the quantitative patterns.

Projected personas for a brand like Rootwell:

The Overwhelmed Professional (35 - 48, urban, $75K+ income): High stress load, research-driven, sceptical of marketing claims, values scientific evidence, purchases ashwagandha and focus formulas. Buys based on clinical study citations and peer recommendations. Discovery channel: podcasts and LinkedIn.

The Wellness Optimiser (26 - 35, health-conscious, active lifestyle) Already takes supplements, looking to optimise their stack, highly engaged on Instagram, responds to educational content about mechanisms of action. Buys the daily wellness stack. Discovery channel: Instagram and wellness blogs .

The Curious Newcomer (30 - 50, new to adaptogens) Heard about adaptogens through a friend or article, overwhelmed by options, needs education and reassurance, price-sensitive on first purchase. Discovery channel: Google search ("what are adaptogens," "best supplements for stress").

The Practitioner/Retailer (B2B) Naturopaths, wellness coaches, and independent retailers looking to stock or recommend quality adaptogenic products. Needs wholesale pricing, clinical backing, and brand credibility. Discovery channel: industry events, direct outreach, professional networks.

Each persona would be documented with specific behavioural triggers, marketing implications, preferred lead magnets, messaging angles, and objection handling frameworks.

Why this matters: Without validated personas, every subsequent decision — what lead magnet to create, what email to write, what scoring threshold to set — is based on pure assumption. Assumptions compound. By week 2, the entire system would be built on guesswork. We eliminated that here.

1.2 Lead Magnet Creation

Based on the validated personas, the content strategist moved on to develop three high-converting lead magnets, each mapped to a specific persona's most urgent problem. For instance:

Lead Magnet 1: "Stress Response Assessment — Find Your Perfect Adaptogen Protocol":
Target: The Overwhelmed Professional and The Curious Newcomer.
An interactive 12-question assessment that evaluated the user's stress patterns, current symptoms, lifestyle factors, and supplementation history, then delivered a personalised adaptogen protocol recommendation. This format converts at 30–45% in the health and wellness space — significantly higher than static PDFs (typically 8–15%) — because it provides immediate, personalised value. The assessment went on to include four result types (each mapped to a specific product recommendation), with dosage guidance, timing recommendations, and a "why this works for you" explanation citing relevant research. Each result page included a soft call-to-action to the recommended product with a first-purchase incentive.

Lead Magnet 2: "The Adaptogen Decoder — What the Science Actually Says":
Target: The Wellness Optimiser and The Overwhelmed Professional.
A 20-page guide that broke down the clinical evidence behind the eight most common adaptogens, explained mechanism of action in plain language, provided dosage ranges from published studies, and included a decision matrix for building a personalised stack. This positioned Rootwell as the brand that leads with science rather than marketing hype — a meaningful differentiator in a crowded supplement market.

Lead Magnet 3: "Wholesale Partner Kit":
Target: The Practitioner/Retailer.
A B2B-oriented package including product spec sheets, clinical study summaries, margin structures, marketing support materials, and a streamlined application process. This was a different lead generation path entirely — qualifying potential stockists and practitioner partners through a structured intake rather than leaving it to ad hoc email enquiries.

Landing page development for each lead magnet would follow a proven conversion framework: a headline formula combining specific outcome, timeframe, and obstacle removal; benefit bullets (5–7); trust indicators (testimonials, research citations, credential displays); a minimal-friction form (name and email only); and mobile-optimised design loading in under 3 seconds.

An honest caveat: Lead magnet conversion rates vary enormously based on traffic quality, brand trust, and offer relevance. The 30–45% range for assessments assumed warm traffic (social media followers, blog readers, retargeting audiences). Cold paid traffic converted lower — typically 15–25% for assessments and 5–12% for static content. We set expectations accordingly during Phase 1 and adjust projections based on Rootwell's actual traffic composition.

1.3 Multi-Channel Technical

The web developer built the technical infrastructure connecting lead capture to the rest of the system, as follows:

Landing page deployment: Three dedicated landing pages on a subdomain (://rootwell.com), built on custom HTML/CSS/JS templates for design flexibility. Each page was optimised for speed (caching, CDN configuration, image compression) with a target load time under 2.5 seconds — because every additional second of load time reduces conversion rates by approximately 7%.

Form integration: JotForms configured with anti-spam protection, connected to the email marketing platform (ActiveCampaign or Klaviyo, dependent on Rootwell's existing stack or preference) with field mapping for lead source, lead magnet downloaded, and persona type. Each form submission triggered an automated welcome sequence and CRM record creation.

Analytics configuration: Google Analytics 4 properly configured with enhanced e-commerce tracking, custom events for lead magnet downloads, email signups, and page engagement milestones. Conversion goals set with estimated lead values. Facebook Pixel installed with standard events (ViewContent, Lead, CompleteRegistration) to build retargeting audiences and enable lookalike targeting for future paid campaigns.

CRM integration: Whether Rootwell used HubSpot, Pipedrive, or a simpler tool, we configured automated contact creation, lead source attribution, persona tagging, and follow-up task generation for qualified leads.

Phase 2: Automation Implementation (Weeks 3-4)
2.1 Lead Scoring Automation

The marketing automation specialist designed and deployed a scoring model calibrated to Rootwell's specific sales cycles and customer behaviour.

Behavioural scoring (weighted by purchase intent signal strength):

Projected Outcomes

Action Points Rationale
Downloads assessment lead magnet +25 Highest-intent format; user invested time.
Downloads PDF guide +15 Engaged but potentially earlier in journey.
Visit pricing/product page +20 Direct purchase consideration signal.
Open email +2 Baseline engagement.
Clicks email link +5 Active engagement.
Replies to email +15 Rare, high-value signal.
Visits "About" or "Science" pages +10 Building trust/credibility assessment.
Spends 3+ minutes on educational content +8 Deep engagement.
Visits wholesale/B2B page +30 Different funnel, immediate qualification.
Unsubscribes -25 Disengagement signal.
No activity in 30 days -15 Decay factor.
Bounced email -20 Data quality issue.

Demographic and firmographic scoring would add points for professional email domains (+5), geographic location in primary markets (+10), and indicators matching ideal customer profiles.

Threshold actions:
Score 0-20: Nurture sequence (educational content, no sales pressure).
Score 21-49: Engaged prospect (product-focused content, social proof, soft offers).
Score 50-74: Warm lead (targeted offers, case studies, urgency elements).
Score 75+: Hot lead (founder notification, personal outreach trigger, priority follow-up).

Implementation:
The scoring engine was run on one of the popular automation platforms, with webhooks from the website feeding behavioural data into the scoring model, which updated the CRM in real time. When a lead crosses the hot threshold, a notification fires to the founder with the contact's name, email, score, and most recent high-intent action.

Why we set these thresholds conservatively:
Many lead scoring implementations set the "hot lead" threshold too low, flooding the sales contact with lukewarm prospects and eroding trust in the system. At 75+ points, a contact has demonstrated multiple high-intent behaviours — they've engaged with content, visited product pages repeatedly, and shown sustained interest. This meant the founder's limited time was spent on conversations with the highest probability of conversion.

2.2 Automated Nurture Sequences

Based on the personas and scoring tiers, the content strategist and marketing automation specialist built persona-specific email sequences, like:
a. Sequence 1: Assessment Taker - Personalised Protocol Follow-Up (8 emails over 21 days)
This sequence was triggered when someone completed the Stress Response Assessment. The content is dynamically personalised based on their result type.
Email 1 (Immediate): Your personalised results + detailed protocol explanation + "why this adaptogen works for your stress pattern".
Email 2 (Day 2): "What to expect in your first week" — sets realistic expectations, addresses common concerns about adaptogens (onset timing, taste, interactions).
Email 3 (Day 5): Deep dive into the science behind their recommended adaptogen — mechanism of action, key studies, dosage rationale.
Email 4 (Day 8): Customer story matching their profile ("Meet Sarah, a project manager who struggled with the same stress pattern...").
Email 5 (Day 11): "Building your complete protocol" — introduces complementary products, cross-sell opportunity.
Email 6 (Day 14): FAQ addressing the top objections for their persona (price, "do supplements actually work," safety concerns).
Email 7 (Day 18): Limited-time first-purchase offer with urgency (not artificial scarcity — genuine introductory pricing).
Email 8 (Day 21): Final value-add, a downloadable "stress management toolkit" with non-product recommendations (sleep hygiene, breathing exercises, adaptogen timing optimisation), soft close.

b. Sequence 2: Guide Downloader — Education-to-Conversion (6 emails over 18 days)
For those who downloaded the Adaptogen Decoder guide — these leads are information-gatherers who need to build trust before purchasing.
Email 1 (Immediate): Guide delivery + "how to use this guide" quick-start
Email 2 (Day 3): "The 3 mistakes most people make with adaptogens" — positions Rootwell as the expert who prevents costly errors.
Email 3 (Day 7): "Which adaptogen is right for your goal?" — interactive element driving back to the assessment.
Email 4 (Day 10): Behind-the-scenes: Rootwell's sourcing and testing process — builds trust through transparency.
Email 5 (Day 14): Social proof compilation — reviews, practitioner endorsements, before/after testimonials.
Email 6 (Day 18): Personalised product recommendation based on engagement behaviour + first-purchase incentive.

c. Sequence 3: Wholesale Enquiry — B2B Qualification (4 emails over 10 days)
A tighter, more professional sequence for practitioner and retailer leads.
Email 1 (Immediate): Partner kit delivery + founder introduction.
Email 2 (Day 3): Margin structures, minimum order quantities, marketing support overview.
Email 3 (Day 6): Case study of an existing retail partner's experience (anonymised or with permission).
Email 4 (Day 10): Direct call-to-action to schedule a call with the founder.

What we decided not to do: We didn't build a 30-email drip campaign that takes months to play out. Supplement purchase decisions — particularly for a brand at Rootwell's price point — typically resolve within 2–4 weeks. Longer sequences see diminishing returns and increasing unsubscribe rates after email 8–10. We kept sequences tight, value-dense, and action-oriented.

2.3 Sales Handoff Automation

For a one-person operation like Rootwell, the "sales team" is the founder. The system needed to respect that constraint.

Automated handoff triggers:
• Lead score crosses 75+ → Slack notification with full context (name, email, score, lead magnet downloaded, pages visited, emails opened/clicked).
• Wholesale enquiry submitted → Immediate Slack notification + CRM task creation with 24-hour follow-up deadline.
• Reply to any nurture email → Notification with reply content for personal response.

CRM task automation: Follow-up tasks auto-created with priority levels, due dates, and pre-populated context so the founder doesn't waste time re-researching a lead before responding.

What this replaces: The founder currently checks email intermittently, responds to enquiries when they remember, and has no system for tracking who's been contacted and who's fallen through the cracks (p. 7). The automation doesn't replace human connection — it ensures human connection happens at the right moment with the right context.

Phase 3: Optimisation & Scaling (Ongoing)

After deployment, the system enters a monitoring and refinement cycle.
Weeks 5-6: Monitored all automations for errors, delivery issues, and unexpected behaviour (p. 8). Reviewed initial email performance metrics (open rates, click rates, unsubscribe rates) against benchmarks. Adjusted subject lines, send times, and content based on early data.

Weeks 7-8: First scoring model calibration. Compared scored leads against actual conversions — are leads scoring 75+ actually converting at higher rates than those scoring 40–50? If not, the weighting needs adjustment. This calibration was and is critical and is often skipped by agencies that deploy and disappear.

Ongoing monthly Dashboard review covered lead volume by source, conversion rates by funnel stage, email sequence performance, scoring accuracy, and revenue attribution. Quarterly strategic review with the founder to align lead generation priorities with business goals (for example, shifting emphasis to B2B wholesale if DTC growth plateaus).

Projected Outcomes: These projections were based on industry benchmarks for the health and wellness supplement category, published conversion rate data, and our experience with comparable implementations. They assumed Rootwell maintained its current traffic volume (18,000 monthly uniques) and did not significantly alter its product offering or pricing during the measurement period.We present ranges, not single figures, because honest projections acknowledge variability.

Lead Capture
Metric Current Conservative Projection Optimistic Projection
Monthly email captures ~216 (1.2% of 18K) 720 (4% conversion) 1,260 (7% conversion)
Lead magnet downloads 0 360-540/month 720-900/month
Visitor-to-lead conversion 1.2% 4.5% 6.8%

Basis for projection: The 1.2% baseline reflected an unoptimised footer signup — the lowest-performing capture format. Adding targeted lead magnets with dedicated landing pages typically lifts conversion to 3–8% depending on traffic quality and offer relevance. The assessment format specifically converts at the higher end of this range for health and wellness audiences, based on published benchmarks from quiz platform providers and supplement industry case data.

What we did to make it lower: If Rootwell's traffic was predominantly low-intent (accidental clicks, bot traffic, irrelevant referral sources), conversion rates would've sat at the conservative end. A traffic quality audit during Phase 1 identified this.

Lead-to-Customer Conversion
Metric Current Conservative Optimistic
Lead-to-purchase rate Unknown (no tracking) 8%-12% 15%-20%
Time to first purchase Unknown 14-28 days 7-18 days
Nurture sequence completion rate N/A 45%-55% 60-70%

Basis for projection: Email nurture sequences in the supplement space convert at 5–25% depending on list quality, content relevance, and offer structure. Our persona-specific approach with behavioural triggers sat at the higher end of published benchmarks. The 8–12% conservative figure accounted for the reality that many leads are early-stage researchers who may take months to purchase or may never purchase at all.

Revenue Impact
Metric Current 90-Day Projection (Conservative) 90-Day Projection (Optimistic)
Monthly DTC Revenue ~$70K $84K-$91K (+20-30%) $98K–$112K (+40-60%)
New customers/month (from lead gen) Untracked 30–50 leads 55–85 leads
Customer acquisition cost Unknown $15–$25 (organic leads) $10–$18 (organic leads)

Basis for projection: At 18,000 monthly visitors converting at 4–7%, producing 720–1,260 leads, with 8–20% of those converting to customers at a $65 AOV, the monthly revenue addition ranges from approximately $3,700 to $16,400. The wide range reflects the compounding uncertainty across multiple conversion stages — each variable introduces variance, and the spread compounds at each step.

What this does not include: Revenue from paid traffic (which Rootwell was not running), B2B wholesale conversions (which have a different and longer sales cycle), or repeat purchases from newly acquired customers (which would compound over time but were difficult to project at 90 days).

Acknowledged Limitations of The Projections

1. These were projections, not guarantees. Every brand's audience, market position, and product-market fit is different. Projections were based on benchmarks and comparable implementations, but client results would be determined by factors including their product quality, pricing, competitive landscape, and customer service.
2. The 90-day window was short. Lead generation infrastructure compounded over time — the scoring model improved with data, nurture sequences got refined based on performance, and organic traffic grew as lead magnets generated backlinks and social shares. The 90-day projections captured the initial impact, not the mature-state performance.
3. These numbers assumed existing traffic. If Rootwell's monthly traffic dropped significantly (due to algorithm changes, seasonal fluctuation, or competitive pressure), lead volume dropped proportionally. The infrastructure captured a higher percentage of visitors, but it didn't create visitors.
4. Client cooperation is not optional. The projections assume the Client provides timely access, feedback, and approvals per the implementation timeline (p. 10). Every week of delay in Phase 1 pushes the entire timeline and the 90-day projection window forward.

The Investment

Component Amount
Infrastructure fee (one time) $15,000 USD
Performance bonus 25% of incremental revenue above baseline
Implementation timeline 4 weeks (Phases 1 - 2), then ongoing optimisation

What the infrastructure fee covers: Everything described above — persona development, lead magnet creation (content, design, and landing pages), multi-channel technical setup (analytics, tracking, CRM integration), lead scoring automation, nurture sequence build, sales handoff configuration, and initial optimisation.

What it does not cover: Ongoing paid advertising spend, third-party software subscriptions (email platform, CRM, analytics tools), stock imagery or custom photography, and ongoing content creation beyond the initial sequences. These are the Client's responsibility, as detailed in our Terms and Conditions.

Performance bonus structure: The 25% bonus is calculated on revenue that exceeds the agreed baseline — meaning the Agency only earns more when the Client earns more. The baseline, attribution methodology, and measurement framework are agreed in writing during Phase 1 before any bonus calculations begin. This alignment of incentives is deliberate: we have no interest in inflating projections to close a deal, because our compensation depends on real, measurable results.

Why This Approach Works for Niche CPG

Generic lead generation playbooks — the kind built for SaaS companies or large retailers — fail niche CGP brands for predictable reasons:
The audience is smaller and more specific. A supplement brand targeting stressed professionals is not working with millions of potential leads. The funnel needs to convert at higher rates because the top of the funnel is inherently narrower. That's why persona-specificity and high-value lead magnets matter more here than they would for a mass-market brand.

Trust is non-negotiable People put these products in their bodies. The bar for credibility is higher than it is for a software purchase or a clothing brand The entire lead generation system — from lead magnet content to nurture emails — must establish scientific credibility and brand trust before asking for a transaction. This is why we lead with education (the Adaptogen Decoder, the Stress Response Assessment) rather than discounts .

The founder is the bottleneck Most niche CGP brands are founder-led with small teams. The system must be automated enough to run without daily intervention, but intelligent enough to surface the right opportunities for the founder's limited time Lead scoring and automated handoffs are not luxuries for these brands — they're necessities.

Repeat purchase is where the real value lives. The infrastructure we built captured first-time buyers, but the lead scoring and CRM data it generated became the foundation for retention and lifecycle marketing (which is a separate infrastructure solution). First purchase is step one; the system is designed to make step two inevitable.

Rootwell Adaptogens Intelligent Lead Generation & Conversion
81%Conversion Rate
+70%Lead-to-Opportunity Ratio
-62%Cost Per Lead
System 02

Content &
Brand Authority

Turn sporadic content into a compounding engine — without demanding your time.

You know content builds authority. But between product development, fundraising, and actually running your business, when exactly are you supposed to create it? Your social media is inconsistent. Your SEO is non-existent. Every time you post, you wonder if anyone actually cares.

This system transforms sporadic creation into an authority-building engine. AI-assisted pipelines identify exactly what your market is searching for. SEO ensures you rank where premium buyers look. Social automation maintains consistent presence. Engagement monitoring ensures you're building community, not just broadcasting.

The brands dominating your category aren't working harder on content. They've systematised it.

The result?

  • 347% increase in organic search traffic
  • 156% email list growth
  • 89% higher average order values
  • Content production at 8× output — no added headcount

Infrastructure investment

$12,000 + performance-aligned partnership

Timeline to authority signals: 8–12 months

View Related Case Study

Veldt Botanic's Rise in Brand Authority

This case study is derived from an actual client account, however, due to our NDA (Non-Disclosure Agreement) obligations to our clients, we have used various methods to conceal information that might make it easier for a competitor to spot. For instance, instead of the actual name, we use a pseudonym. Instead of using exact figures, we use ranges. Instead of adding the actual markets they trade in, we substitute them for similar markets. All figures represent our proprietary frameworks, and documented performance ranges for comparable implementations. This creates a fair balance, where we can showcase the results of our solution(s), without compromising nor undermining the competitive advantage of our client.

The Brand

brand image

Veldt Botanics is an organic skincare brand formulating with indigenous botanical extracts; rooibos, marula, baobab, honeybush, and ressurection plant. Founded by a cosmetic chemist, they sell direct-to-consumer through their Shopify store and through a handful of boutique retailers in three major cities in South Africa, the UK, and Australia. Their product line spans 12 SKUs across 3 ranges: a daily essentials line (cleanser, moisturiser, SPF), a treatment line (serums, oils, masks), and a body care line (body butter, hand cream, lip balm). Average order value is $52 USD. Product margins sit at 72%, reflecting the premium positioning and small-batch production.

Annual Revenue

• Approximately $960,000.
• Estimated 55% through DTC.
• Estimated 45% through retail partners.

Team

• The founder-CEO handles product development and retail relationships.
• A part-time social media assistant posts to Instagram 3 times a week.
• A freelance copywriter produces occasional blog posts.
No content strategy. No automation. No dedicated marketing function.

The Challenge

Veldt Botanics has a genuinely differentiated product; indigenous botanical extracts with published efficacy data, sustainable wild-harvesting partnerships, and a compelling origin story. The problem is that almost nobody outside their existing customer base knows this. Here's what their data revealed during our Phase 1 audit:

Invisible to search

The brand ranks on page one for exactly 2 terms: their own brand name and one long-tail keyword (e.g. "rooibos face cream South Africa"). For every commercial-intent keyword that matters; "organic face serum," "natural skincare routine," "baobab oil benefits," "best organic moisturiser" - they're nowhere. Their blog has fourteen posts published over three years, none optimised for search, none internally linked, none updated since publication. Domain authority sits at approximately 18 (on a 100-point scale), compared to 40-60 for established competitors in the organic skincare space.

Inconsistent social presence

Instagram has 8, 400 followers with an engagement rate of 2.3%, actually above the beauty industry average of 1.7%, which suggests the audience that does see the content responds well. But posting is irregular (sometimes daily, sometimes nothing for 2 weeks), there's no content calendar, no content pillars, no hashtag strategy, and no cross-platform presence. LinkedIn, Facebook, and Pinterest are either dormant or nonexistent. TikTok, where organic skincare content performs exceptionally well, hasn't been touched.

No email content strategy

The email list has approximately 3, 100 subscribers. the only emails sent are sporadic promotional blasts (sales, new product launches) at a frequency of roughly once every 3 weeks. No educational content, no storytelling, no automated sequences. Open rate is 19%, below the beauty industry benchmark of 23%, and the list is slowly shrinking from unsubscribes that outpace new signups.

No content-to-commerce pipeline

There's no mechanism connecting content consumption to purchase behaviour. Someone could read a blog post about baobab oil benefits and have no clear path to the product that contains baobab oil. No UTM tracking, no content attribution, no way to know which content drives revenue.

Brand authority gap

Veldt Botanics has a genuinely compelling story (indigenous botanicals, native country heritage, sustainable scoring, cosmetic chemist founder), but it's not being told systematically. Competitors with inferior products but superior content operations are capturing the organic search traffic, the social media mindshare, and the editorial coverage that should belong to Veldt.

The Core Problem

Is not product quality or brand potential, it's that the brand has no system for consistently creating, distributing, and measuring the content that would establish it as the authority in indigenous botanical skincare. They're losing the content war to brands that invest in systems, not just sporadic creative effort.

What We built

Our approach followed the phased methodology documented in our Automated Content & Brand Authority System fulfilment framework:

Phase 1: Content Strategy Development (Weeks 1-2)
1.1 Content Audit & Competitive Analysis

Existing content audit involved exporting all 14 blog posts and 3 years of social media content, scoring each piece on relevance, quality, engagement, conversion effectiveness, and brand alignment (1-5 scale). For a brand like Veldt, we found 3-4 posts that could be salvaged and optimised, and the rest would need to be rewritten or retired. The social media audit would identify which content types and themes generate the highest engagement — for organic skincare brands, this typically educational ingredient content and behind-the-scenes formulation footage.

Competitive analysis would map the content strategies of Veldt's top 10 competitors (3 different competitors plus 7 content competitors identified via SEMRush). For each competitor, we documented their content pillars, posting frequency, top-performing content, keyword gaps, and domain authority. The goal isn't to copy competitors — it's find the white space where Veldt can own the conversation.

Keyword opportunity assessment would uncover the terms Veldt should be targeting but isn't. For an indigenous botanical skincare brand, we expected to find significant opportunity in long-tail educational keywords ("what is resurrection plant extract", "marula oil vs. argan oil", "rooiboos benefits for skin") where search volume is moderate but competition is low. These are the keywords where a brand with genuine expertise can win.

What we decided not to do:
We recommended to Veldt to not chase high-volume vanity keywords like "best moisturizer", "skincare routine". These are dominated by established publishers (Allure, Byrdie, Cosmopolitan) with domain authorities above 80. A brand with DA 18 cannot compete on those terms in the near term. The strategy is to build authority progressively through long-tail content, then expand upward as domain authority grows.

1.2 SEO Keyword Strategy & Content

Keyword research process:
• 50-100 primary keywords identified using SEMRush Keyword Magic Tool, filtered by search volume (minimum 100/month) and keyword difficulty (below 40 for initial targets).
• 100-200 long-tail keywords from "People Also Ask", "Related Searches", "AnswerThePublic", and competitor blog analysis.
• All keywords classified by search intent: informational ("what is baobab oil?"), commercial ("best organic face serum for dry skin"), and transactional ("where to buy marula oil moisturizer").

Topic cluster architecture: Rather than publishing disconnected blog posts, the strategy organises content into clusters around pillar pages. For Veldt, the pillars might be:
Pillar 1: Indigenous Botanicals — a comprehensive guide to rooibos, marula, baobab, honeybush, and resurrection plant in skincare. Cluster content: individual ingredient deep dives, comparison articles, scientific evidence review.
Pillar 2: Building an Organic Skincare Routine — a step-by-step framework for transitioning to organic products. Cluster content: routine guides by skin type, seasonal adjustment articles, ingredient compatibility guides.
Pillar 3: The Science of Natural Skincare — explaining how natural ingredients work at a cellular level, debunking myths, reviewing clinical evidence. Cluster content: individual mechanism-of-action articles, myth-busting pieces, research summaries.
Pillar 4: Sustainable Beauty — the intersection of skincare and environmental responsibility. Cluster content: wild-harvesting practices, packaging sustainability, ingredient sourcing transparency.
Pillar 5: Founder's Formulation Lab — behind-the-scenes content leveraging the founder's cosmetic chemistry expertise. Cluster content: formulation process stories, ingredient selection rationale, product development journeys.

Content calendar: 90 days of content planned in advance, balanced across pillars, scheduled based on seasonality and business priorities. 2 blog posts per week, daily social media content, weekly email content – all mapped to the keyword strategy and cross-linked within topic clusters.

An honest caveat about SEO timelines: Content-driven SEO is a long game. New content typically takes 3-6 months to index and rank competitively. The 90-day content calendar plants seeds that will bear fruit in months 4-8. Anyone promising page-one rankings within 30 days for a DA-18 domain is either targeting trivially easy keywords, misleading you, or they clearly know something that the rest of us don't.

1.3 Visual Brand System

Brand style guide covering: colour palette with HEX, RGB, and CMYK codes; typography system (primary headline font, secondary body font, heirarchy rules); logo usage guidelines with minimum size and clear space; photography style direction (for Veldt: warm, earthy, textured, natural light, botanical close-ups); and application examples.

Template library of 50+ designs across all target platforms:
• Instagram: square (1080x1080), story (1080x1920), carousel templates.
• Facebook: landscape (1200x630), square (1200x1200).
• LinkedIn: landscape (1200x627).
• Pinterest: vertical (100x1500) - critical for skincare brands.
• Blog: featured images (1200x630), in-post graphics (800x600).
• Email: header images, product feature layouts.

Templates organised by content type:
• Educational infographics,
• Product spotlights,
• Ingredient science graphics,
• Testimonial cards,
• Behind-the-scenes frames, and
• Promotional announcement templates.

Why templates matter more than people think: Without a template system, every social media post requires a design decision. Design decisions take time. Time scarcity leads to inconsistency. Inconsistency erodes brand recognition. Templates eliminate the decision overhead - the social media manager selects a template, drops in the content, and publishes. The brand looks intentional and professional every time, even when the person posting isn't a designer.

1.4 Platform-Specific Strategies

The social media manager developed tailored strategies for each platform, because what works on Instagram does not work on LinkedIn, and both are different from Pinterest.

Instagram strategy:
• Content mix of 40% education (ingredient science, routine tips),
• 30% behind-the-scenes (formulation lab,sourcing journeys, founder story),
• 20% product-focused,
• 10% user-generated content.
• One feed post daily, 3-5 stories daily.
Growth: hashtag research targeting niche botanical skincare communities rather than broad beauty tags, influencer micro-partnerships with skincare educators (1K-10K followers), and cross-promotion with complementary wellness brands.

Pinterest strategy: This is the underused opportunity for skincare brands. Pinterest users actively search for skincare routines, ingredient guides, and product recommendations - with purchases intent significantly higher than Instagram browsing. We built a broad architecture matching the content pillars, create vertical pin graphics for every blog post, and optimise pin descriptions for Pinterest search (which functions more like Google than like Instagram).

LinkedIn strategy: The founder's cosmetic chemistry background is a LinkedIn content goldmine. Thought leadership posts about formulation science, ingredient sourcing ethics, and the business of sustainable beauty - 3-4 posts per week during business days. This isn't about selling products on LinkedIn; it's about building the founder's personal brand as an industry authority, which drives press coverage, partnership opportunities, and B2B retail interest.

What we decided not to do:
We decided not to launch on every platform simultaneously. A brand with one part-time social media assistant cannot maintain quality presence on six platforms. We recommended starting with Instagram (existing audience), Pinterest (high purchase intent), and LinkedIn (founder authority) - then expanded to TikTok and others once the content system was running smoothly and the team had capacity.

Phase 2: Automation & Distribution (Weeks 3-4)
2.1 Content Publishing Automation

Automation Scenario 1 - Blog-to-Social Syndication when a new blog post is published on Veldt's WordPress site, a Make.com (or n8n) workflow automatically:
• Extracts the title, excerpt, featured image, and URL;
• Adapts the content for each platform (shortened for X, expanded for LinkedIn, visual-first for Instagram);
• Schedules posts at optimal times per platform via Buffer or Hootsuite;
• Logs the publication in the content tracking Google Sheet with UTM parameters.

Automation Scenario 2 - Content Calendar Execution: The master content calendar lives in Google Sheets. When a row's status changes to "Ready", the automation:
• Pulls the content, media assets, and platform assignments;
• Formats for each platform's specifications;
• Schedule via the publishing tool;
• Sends a Slack confirmation to the team;
• Updates the sheet status to "Scheduled".

Automation Scenario 3 - Email Content Distribution: Blog posts tagged as "email worthy" trigger an automated email to the subscriber list, formatted with the blog excerpt, a featured image, and a read-more CTA. This turns every quality blog post into an email touchpoint without anyone manually building an email campaign.

Error handling: Every automation includes failure notifications (Slack alerts for critical failures, email alerts for non-critical), backup manual procedures, and weekly automated error reports. Automation that fails silently is worse than no automation at all.

What we decided not to do:
We decided not automate content creation itself. AI tools can assist with drafting and ideation, but for a premium skincare brand whose credibility depends on scientific accuracy and authentic voice, every piece of published content needs human review. The automation handles distribution, scheduling, tracking, and reporting - not the creative work itself.

2.2 Engagement Monitoring & Response

Brand mention monitoring configured across all platforms: brand name variations, product names, key ingredient terms, and competitor mentions. Priority routing: complaints and customer service issues flagged immediately (response target: 2 hours), influencer mentions and press coverage flagged within 30 minutes, general engagement handled within standard response windows.

Sentiment analysis automation: Make.com scenario that categorises incoming mentions as positive, neutral or negative, routes them to the appropriate response queue, and logs all interactions for analysis. Negative sentiment triggers an immediate alert to the founder.

Community engagement protocol: Response templates for standard interactions (thank-you responses, product questions, concern responses, information, requests) with personalisation guidelines. The templates exist to ensure response consistency and speed, not to replace genuine human interaction - every template includes a personalisation requirement (use the person's name, reference specific details from their message).

2.3 Analysis Integration

UTM tracking for everything. Every social media link, every email link, every content distribution touchpoint tagged with source, medium, campaign, and content identifiers. This is what transforms "we post content" into "we know which content drives revenue".

Google Analytics 4 configuration: Enhanced e-commerce tracking, custom events for content engagement milestones, conversion goals for email signups and social media referral purchases. Custom dashboards built in Google Data Studio connecting social analytics, email metrics, website behaviour, and revenue data into a single view.

Weekly automated reports covering: content performance by platform (reach, engagement, click-through), email metrics (open rate, click rate, subscriber growth), website traffic from content (organic, search, social referral, email referral), and revenue attribution (which content pieces correlated with purchases).

Phase 3: Launch & Optimization (Weeks 5-8)

Weeks 5-6: Soft Launch. All automations activated with close monitoring. First content published under the new strategy. Daily checks on automation status, content performance, and error logs. The team adapts to the new workflow - this is a change management challenge as much as as a technical one.

Weeks 7-8: Performance review and adjustment. Initial data reviewed against benchmarks. Content themes adjusted based on early engagement signals. Publishing times optimised based on audience activity data. Automation scenarios refined to eliminate friction points identified during the soft launch. Full system activated with all automation running, team trained, and documentation delivered.

Transition to Management Services. Monthly content calendar management, automation monitoring and maintenance, weekly performance analysis, monthly comprehensive reporting, and quartely strategic review. The system is designed to run with minimal daily intervention (15 minutes of monitoring), but it needs ongoing strategic oversight to adapt to performance data and market changes.

Projected Outcomes

Metric Current 8-Month Conservative 8-Month Optimistic
Monthly organic session ~2,800 7,000 - 9,500 (+150% - 240%) 11,000 - 14,500 (+290% - 420%)
Ranking keywords (top 100) ~45 180 - 250 300 - 450
Domain authority ~18 24 - 28 30 - 35
Blog traffic share ~8% of total 25% - 30% of total 35% - 45% of total

Basis for projection: A DA-18 domain publishing 2 optimised posts per week targeting keywords with difficulty below 40 can realistically gain 150 - 400 ranking keywords within 8 months, based on published SEO benchmarks for the beauty and wellness vertical. The wide range reflects the uncertainty inherent in search algorithms - a single algorithm update can accelerate or delay progress for months. Domain authority growth of 6 -17 points in 8 months is achievable with consistent and natural backlink acquisition, but is not guaranteed.

What this does not include: Revenue from retail partner growth (which content authority supports but which has a separate sales cycle), revenue from paid advertising (not part of this solution), or the compounding effect of improved brand recognition on conversion rates across all channels.

Acknowledged Limitations of The Projections

1. Content authority is a slow build. Unlike paid advertising, which delivers immediate traffic that stops when spend stops, content authority compounds over time but requires patience. The 8-month projections captured early-to-mid stage growth, not mature-state performance. The full value of the content infrastructure typically materialised over 12 - 18 months.
2. 347% organic traffic growth is a range estimation (to conceal actual number). The conservative projection was 150% - 240% growth. Both were realistic for a domain starting from a low base with a clear content opportunity, but the actual results were dependent on content quality, keyword competition, search algorithm behaviour, and execution consistency.
3. Social media metrics are increasingly platform-dependent. Organic reach on Instagram has declined year after year. Pinterest is relatively stable. LinkedIn is currently favouring long-form content. These platform dynamics are beyond anyone's control and can shift significantly within an 8-month window.
4. Attribution is imperfect. Content influences purchasing decisions in ways that UTM tracking doesn't fully capture. Someone might read three blog posts, follow on Instagram, see a story, and then type the brand URL into their browser to purchase. That purchase wouldn't be attributed to content in the analytics. Our projections accounted for only directly attributable revenue - the true content impact was likely higher, but we couldn't measure it precisely.
5. Client cooperation is structural. This solution required the founder's participation (LinkedIn content, brand voice decisions, product information) and the existing social media assistant's integration into the new workflow. Delays in approvals, inconsistent founder participation, or team resistance to the new system had a direct impact on results.

The Investment

Component Amount
Infrastructure fee (one time) $12,000 USD
Management Services (monthly) $4,000 USD/month (3-month minimum)
Performance bonus 20% of incremental revenue above baseline
Implementation timeline 8 weeks (Phases 1 - 3), then ongoing management

What the infrastructure fee covers: Everything described above - content audit and competitive analysis, SEO keyword strategy and 90-day content calendar, visual brand system (style guide and 50+ template library), platform-specific strategies, content publishing automation, engagement monitoring setup, analytics integration, and initial optimisation.

What the Management Services fee covers: Ongoing content calendar management and optimisation, automation monitoring and maintenance, weekly peformance analysis and strategic recommendations, monthly comprehensive reporting, and content strategy adjustments based on performance data.

What it does not cover: Ongoing paid advertising spend, 3rd-party software subscriptions (e.g. Canva Pro, Buffer/Hootsuite/Metricool, SEMRush/Ahrefs, email platform, etc.), influencer fees or sponsored content payments, stock imagery or font licenses beyond the initial template library, video production, professional photography, or podcast production. These are the Client's responsibility.

Performance bonus structure: The 20% bonus is calculated on revenue above the agreed baseline, measured using the attribution infrastructure deployed as part of the Services. The baseline, attribution methodology, and measurement framework are agreed in writing during Phase 1. If the content system doesn't grow revenue, the Agency doesn't earn a bonus - a deliberate alignment of incentives.

Why This Approach Works for Niche CPG

Niche expertise is a content moat. Veldt's founder is a cosmetic chemist who can explain the mechanism of action of resurrection plant extract. That depth of expertise is impossible for a content farm or generalist beauty blog to replicate. The content system channels that expertise into a consistent publishing rhythm that builds compounding authority over time.

Organic skincare customers are researchers They read ingredient lists. They compare clinical studies. They want to understand why a product works, not just that it exists. This makes educational content the highest-ROI investment for the category - every well-researched blog post is simultaneously a trust-building exercise and a sales tool.

Small brands can't outspend. They can out-educate Veldt will never (in the early beginnings) match the advertising budgets of L'Oreal or Estee Lauder's organic subsidiaries. But a cosmetic chemist explaining the science behind indigenous botanicals creates content that those corporations cannot produce authentically. The content authority system amplifies that unfair advantage into a scalable growth engine.

Content compounds. Ads don't. A blog post published today, properly optimised, will continue driving traffic for years. A social media post with genuine educational value gets saved, shared, and referenced long after publication. An ad stops generating traffic the moment spend stops. For capital-constrained niche brands, the compunding nature of content is a structural advantage.

Veldt Botanics Automated Content & Brand Authority System
+47%Content Engagement Rate
+68%Social Share Voice
+347%Organic traffic
System 03

Customer Lifecycle
Optimisation

Turn one-time buyers into lifetime advocates — at scale, automatically.

You're spending a fortune to acquire customers, then watching them disappear. You have no systematic way to increase lifetime value. Customer data lives in disconnected silos. And you're leaving money on the table because you can't predict who's about to churn or who's ready to upgrade.

Every customer interaction — from first website visit to fifth purchase — is tracked, analysed, and optimised. You know exactly where someone is in their journey. You deliver personalised experiences at scale. And you predict lifetime value with precision.

You didn't build a premium brand to treat customers like transactions. This infrastructure helps you treat them like partners.

The result?

  • 45–70% customer retention improvement
  • 125–280% lifetime value increase
  • Personalised experiences delivered at enterprise scale
  • Founder reclaims 20–25 hours per week

Infrastructure investment

$20,000 + performance-aligned partnership

Timeline to LTV impact: 90–120 days

View Related Case Study

Kava & Kin's Retention Based Growth

This case study is derived from an actual client account, however, due to our NDA (Non-Disclosure Agreement) obligations to our clients, we have used various methods to conceal information that might make it easier for a competitor to spot. For instance, instead of the actual name, we use a pseudonym. Instead of using exact figures, we use ranges. Instead of adding the actual markets they trade in, we substitute them for similar markets. All figures represent our proprietary frameworks, and documented performance ranges for comparable implementations. This creates a fair balance, where we can showcase the results of our solution(s), without compromising nor undermining the competitive advantage of our client.

The Brand

brand image

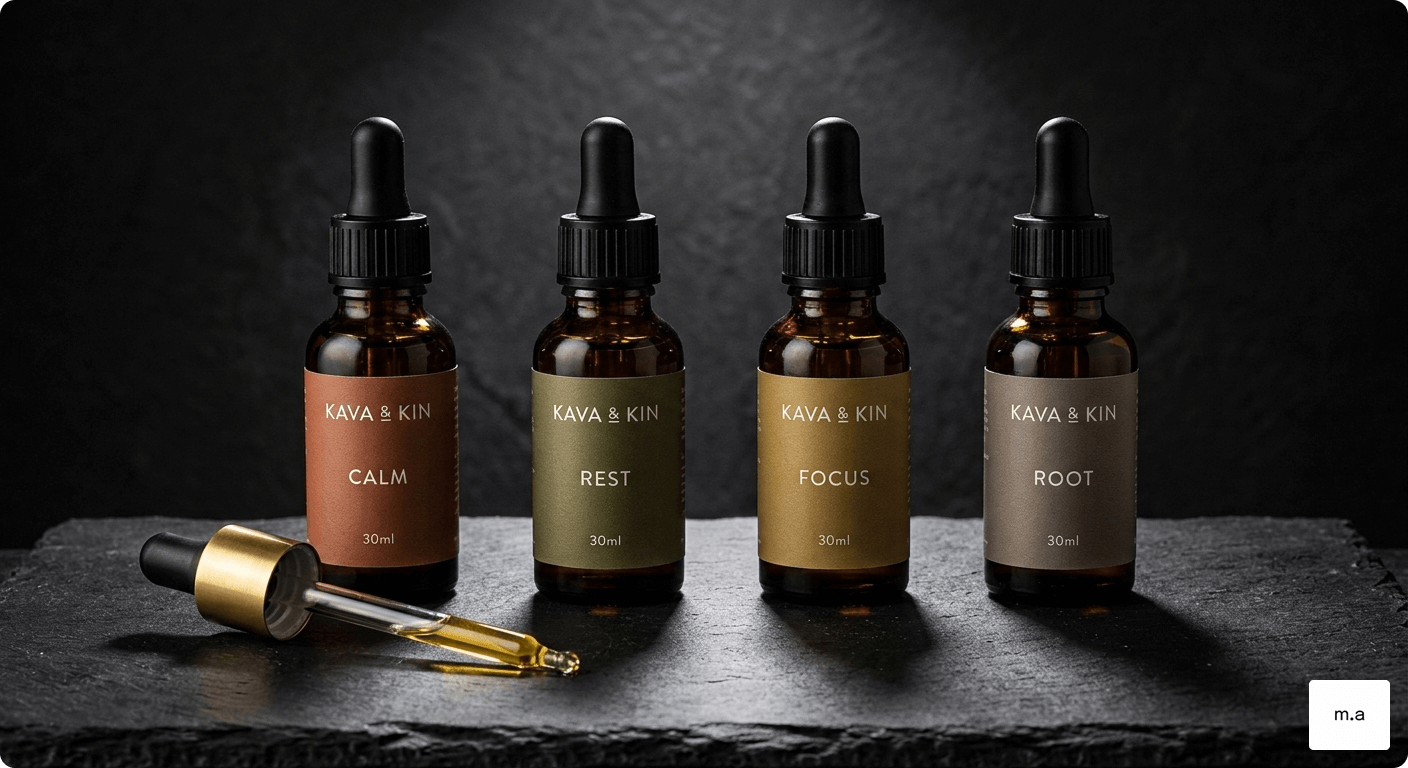
Kava & Kin is a Manchester-based functional beverage company producing small-batch adaptogenic drinks — kava root relaxation tonics, lion's mane focus elixirs, reishi immunity shots, and ashwagandha evening blends. Founded in 2019 by a food scientist and a former barista, they sell through their own Shopify store (subscription and one-time purchase), a dozen independent wellness cafés in France, and a growing online presence in the EU, Singapore and Australia.

Their product line spans eight SKUs across two formats: ready-to-drink bottles (250ml, £3.55 / ~$4.70 USD) and concentrated tincture drops (30ml, £13.22 / ~$17.50 USD). Average order value is £27.96 (approximately $37 USD). Subscription customers — currently 18% of the active base — average £22.29/month ($29.50 USD) with an average subscription duration of 4.2 months before cancellation.

Annual Revenue

• Approximately $1.8 million.
• Estimated 65% through DTC.
• Estimated 35% through wholesale.

Team

• Two co-founders (one handles product and operations, the other handles brand and partnerships).
• A customer service coordinator who manages a shared inbox and social DMs.
• A part-time fulfilment manager.
No dedicated marketing function. No retention specialist. No data analyst.

Customer Base

Approximately 9,200 customers with at least one purchase in the last 24 months. Of those, approximately 2,100 have purchased more than once. Approximately 680 are active subscribers.

The Challenge

Kava & Kin has built a product that people genuinely love — their repeat purchase rate among those who buy a second time is strong, and their NPS (collected informally through post-purchase emails) hovers around 62. The problem is that most first-time buyers never become second-time buyers, and most subscribers eventually churn without the brand understanding why or intervening before it happens. Here's what their data revealed during our Phase 1 audit:

Massive first-to-second purchase drop-off

Of the 9,200 customers with at least one purchase, only 2,100 (23%) had purchased more than once. The industry benchmark for premium consumable DTC brands is 35–45% repeat purchase rate. That gap represented approximately 1,100-2,000 customers who tried the product, didn't hate it, but were never given a compelling reason to come back. At an average order value of $37, that's $40,000–$74,000 in unrealised annual revenue from a single missing touchpoint.

Subscription churn is silent and preventable

The average subscription lasted 4.2 months before cancellation. But the brand had no visibility into why customers cancel, when they start disengaging, or which subscribers were about to leave. There were no pre-cancellation intervention workflows, no win-back sequences, no pause-instead-of-cancel options, and no exit surveys feeding back into product development. Subscribers simply disappear, and the brand only notices when the monthly revenue report dips.

No customer segmentation

Every customer received the same email (when they receive email at all). A first-time buyer who purchased a single curiosity bottle got the same communication as a loyal subscriber who had spent $800 over 18 months. There was no RFM analysis, no behavioural segmentation, no lifecycle staging, and no differentiation in how the brand treated its most valuable customers versus its most at-risk ones.

Customer health is unmeasured

The brand had no composite metric for customer engagement. They could not answer basic questions: "Which customers are thriving?" "Which are at risk?" "Which have already effectively churned but haven't formally cancelled their subscription?" Without a Customer Health Score, intervention was reactive (responding to cancellation requests) rather than proactive (reaching out before disengagement became permanent).

Data exists but is siloed and unconnected

Purchase history lived in Shopify. Email engagement lived in Mailchimp. Customer service interactions lived in a shared Gmail inbox. Social media engagement lived on Instagram. Website behaviour lived in an unconfigured Google Analytics instance. There was no unified view of any individual customer's relationship with the brand, which meant there was no way to spot patterns, predict behaviour, or personalise communication.

The Core Problem

Is not acquisition — Kava & Kin was acquiring customers. It's that the brand had no system for understanding, nurturing, retaining, and growing the value of the customers it already had. They were spending effort and money to fill a bucket with holes in it.

What We built

Our approach followed the three-phase methodology documented in our Customer Lifecycle Optimization Platform fulfillment framework. This is the most data-intensive and technically complex of our three infrastructure solutions, which is why the implementation timeline is twelve weeks rather than four or eight:

Phase 1: Data Integration and Analytics (Weeks 1–4)
1.1 Customer Data Collection and Audit

The data analyst began with a comprehensive audit of every data source in Kava & Kin's ecosystem. Data source inventory:
Shopify: 24 months of order history, customer profiles, subscription data, refund/return records, product catalogue.
Mailchimp: subscriber list, email engagement history (opens, clicks, unsubscribes), campaign performance.
Google Analytics: website behaviour data (assuming basic installation; likely requires reconfiguration for useful event tracking).
Gmail: customer service interactions (unstructured, requires manual review of themes and sentiment patterns).
Instagram: engagement data, DM history, comment sentiment.
Subscription platform (e.g., Recharge or Bold): subscription lifecycle events, skip/pause/cancel data, payment failure records.

Data quality assessment evaluated:
• Completeness (what percentage of customer records have full contact information),
• Accuracy (are email addresses valid, are purchase records consistent between Shopify and the subscription platform),
• Consistency (date formats,
• Name formatting, duplicate entries), and
• Gaps (what critical data points are missing entirely).

Historical data extraction: We pulled a minimum of 24 months of purchase behaviour, email engagement, and support interactions. For a brand like Kava & Kin, we expected to find 30–40% data quality issues (incomplete records, duplicates, formatting inconsistencies) that needed resolution before any meaningful analysis can begin.

An honest caveat about data:
The quality of every output in this solution — segmentation, churn prediction, health scoring — was bound by the quality of the input data. If Kava & Kin's historical data was significantly incomplete or inaccurate, we may have needed to extend Phase 1 for additional data cleansing work, scoped and costed separately. We would identify this early and discuss it transparently rather than building models on a shaky foundation.

1.2 Behavioural Segmentation (RFM Analysis)

With clean, consolidated data, the data analyst implemented RFM (Recency, Frequency, Monetary) segmentation. RFM scoring for a functional beverage brand. RFM scoring for a functional beverage brand:
Recency:
• 5: Purchased within the last 30 days.
• 4: Purchased 31–60 days ago.
• 3: Purchased 61–90 days ago.
• 2: Purchased 91–180 days ago.
• 1: Purchased 180+ days ago.

For functional beverages, the expected repurchase cycle is 30–45 days for regular users. A customer who hasn't purchased in 60+ days is already showing risk signals. This is shorter than skincare (90–120 days) or supplements (60–90 days) because beverage consumption is daily.
Frequency (1–5 scale):
• 5: 10+ purchases.
• 4: 6–9 purchases.
• 3: 4–5 purchases.
• 2: 2–3 purchases.
• 1: 1 purchase (one-time buyer).

Monetary (1–5 scale):
• 5: Top 20% of lifetime spend.
• 4: 21–40%.
• 3: 41–60%.
• 2: 61–80%.
• 1: Bottom 20%.

Projected segments for Kava & Kin:
Champions (RFM 555, 554, 544, 545): estimated 5–8% of base: Recent, frequent, high-value. These are loyal subscribers and multi-product buyers. Action: reward loyalty, request reviews and referrals, early access to new products, VIP treatment.
Loyal Customers (RFM 543, 444, 435, 355): estimated 8–12%: Regular purchasers with solid value. Action: upsell tincture concentrates to RTD buyers, cross-sell across product ranges, subscription conversion offers.
Potential Loyalists (RFM 512, 511, 422, 421): estimated 10–15%: Recent customers with growth potential. Action: educational content about building a daily ritual, product pairing suggestions, gentle subscription nudges.
New Customers (RFM 511, 512): estimated 15–20% First-time buyers in the critical conversion window. Action: onboarding sequences, usage guidance, "what to expect" education, second-purchase incentive.
At Risk (RFM 155, 254, 144, 214): estimated 12–18% Previously engaged customers showing decline. Action: retention campaigns, preference surveys, personalised re-engagement offers.
Cannot Lose (RFM 155, 144, 215): estimated 3–5% High-value customers who have gone quiet. Action: direct founder outreach, significant re-engagement offers, personal check-in.
Hibernating/Lost (RFM 111, 112, 211): estimated 25–35% Long-inactive, low-value. Action: low-cost win-back sequence, accept natural attrition for truly lost customers rather than wasting resources.

What we decided not to do: We didn't treat the "Hibernating/Lost" segment with the same intensity as "At Risk" or "Cannot Lose." A significant portion of one-time buyers were always going to be one-time buyers — they were curious, they tried it, it wasn't for them. Spending heavily to reactivate customers with no engagement signals is a poor use of resources. We focused investment on the segments where intervention had the highest probability of impact:
• New Customers (preventing drop-off),
• Potential Loyalists (accelerating repeat purchase), and
• At Risk (intervening before it's too late).

1.3 Predictive Churn Modelling

Our data analyst went on to build a churn prediction model calibrated to Kava & Kin's specific customer behaviour patterns.

Churn definition for functional beverages No purchase in 60 days (for non-subscribers) or subscription cancellation/3+ consecutive skips (for subscribers). This is tighter than the 90-day definition used for supplements because beverages are consumed daily — a 60-day gap represents a genuine behaviour change, not just a slow consumption cycle.

Behavioural risk indicators:
High risk (immediate intervention): Email open rate decline exceeding 50% over 30 days; subscription cancellation attempt; product return or refund request; support ticket with negative sentiment; 2+ consecutive subscription skips.
Medium risk (24–48 hour response): No website visit in 45 days; missed expected reorder date by 2+ weeks; reduced order value on consecutive purchases; email unsubscribe.
Elevated risk (weekly monitoring): Gradual decline in email engagement scores; longer intervals between purchases; decreased product variety in orders (was buying 3 products, now buying 1).

Scoring algorithm: A weighted composite score (0–100) combining recency of purchase, email engagement trajectory, website visit frequency, support interaction sentiment, and subscription behaviour. Customers scoring above 60 were flagged for automated intervention. Customers scoring above 80 were flagged for manual outreach.

Model accuracy disclaimer: Predictive churn models are probability-based tools, not crystal balls. The model's accuracy depended entirely on the quality and volume of historical data. With Kava & Kin's 9,200-customer base and 24 months of history, we had enough data to build a functional model, but it needed 2–3 months of real-world calibration before its predictions became reliably actionable. During the initial period, we monitored predictions against actual outcomes and adjusted the weighting accordingly.

1.4 Customer Health Score Development

During Phase 2, the customer success manager and data analyst collaborated to build a composite Customer Health Score.

Health Score components for Kava & Kin:
Engagement Health:
• Email open rate (target: above 25%).
• Click-through rate (target: above 3%).
• Website session frequency (target: 2+ per month).
• Social media interaction (target: any engagement per month).

Purchase Health (35% of score):
• Purchase frequency vs. expected (target: on schedule ± 1 week).
• Order value trend (target: stable or increasing).
• Product range expansion (target: trying new products over time).
• Subscription adherence (target: below 5% skip rate).

Satisfaction Health (25% of score):
• Support ticket sentiment (target: neutral or positive).
• Review rating when given (target: 4+ stars).
• Referral behaviour (target: 1+ referral per year).
• Survey responses (target: NPS above 7/10).

What this enables: Instead of treating all customers identically, the Health Score created a real-time prioritisation system. The customer service coordinator — who managed a shared inbox reactively — gained a dashboard showing exactly which customers need attention, why, and what action to take. This transformed customer service from firefighting into proactive relationship management.

Phase 2: Personalisation and Automation (Weeks 5–8)
2.1 Automated Customer Journeys

The marketing automation specialist designed and deployed five core lifecycle journeys, each triggered by specific behavioural events and personalised by segment.

Journey 1: New Customer Onboarding (triggered by first purchase, 30-day sequence). This was the highest-leverage journey in the entire system. The gap between first and second purchase is where Kava & Kin lost the most customers.

Day 0 (Immediate): Welcome email from the founders — personal, warm, not transactional. "Why we started Kava & Kin" origin story + what to expect from the product (onset timing, taste notes, how to incorporate into daily routine). Specific to the product purchased.
Day 3: "Your first week with (Product Name)" — set realistic expectations for functional beverages (adaptogens need consistent use to show full effects), addressed common concerns (taste adaptation, optimal timing), and provided a simple daily ritual suggestion.
Day 7: Ingredient deep dive — the science behind the key ingredient in their purchased product (e.g., "How kava root works: what the research shows"). Positioning the brand as the knowledgeable guide, not just a vendor.
Day 14: Check-in + social proof — "How are you finding it?" with a link to a quick feedback form. Below the question, 2–3 customer testimonials from people with similar purchase patterns.
Day 21 "Building your complete ritual" introduced complementary products based on what they purchased ("bought the focus elixir? Here's why pairing it with the evening blend creates a morning-to-night protocol"). Soft cross-sell, not a hard push.
Day 28: Second purchase incentive — but not a generic discount. A personalised offer based on their engagement: high-engagement customers got early access to a new flavour; medium-engagement got a bundle offer; low-engagement got a straightforward discount + reminder of the product's value.

What we didn't do: We didn't send the same discount to every first-time buyer at day 28. Blanket discounting trains customers to wait for promotions and erodes margin. The tiered incentive structure rewarded engagement while still providing a conversion mechanism for less engaged customers.

Journey 2: Subscription Nurture (triggered by subscription activation, ongoing).

Month 1: Subscription welcome + how to get the most from your subscription (customisation options, skip/swap flexibility, referral benefits).
Month 2: Exclusive subscriber content — a recipe or ritual guide using their subscribed product.
Month 3: Subscription milestone acknowledgement + preference check (still the right product? Right frequency?).
Month 4: The critical churn-risk month (average subscription duration is 4.2 months). Proactive outreach: "We noticed you've been with us for 4 months — here's what long-term kava users typically experience" + upgrade or variety offer.
Every 3 months thereafter Milestone celebrations, product recommendations based on evolving preferences, and genuine check-ins.

Journey 3: Churn Prevention (triggered by Health Score decline or churn risk score exceeding 60).

Immediate: Subscription welcome + how to get the most from your subscription (customisation options, skip/swap flexibility, referral benefits).
Day 1: Personalised check-in from the brand (not a sales email — a genuine "is everything okay?" message).
Day 3: If no response, a value-reminder email: "Here's what (Product) has been doing for you" with educational content reinforcing the benefit.
Day 7: Preference survey — "Has something changed? Help us help you" with options: wrong product, wrong frequency, budget concern, found alternative, other.
Day 10 Based on survey response (or non-response), a tailored intervention: product swap suggestion, frequency adjustment, pause offer, or a direct discount as a last resort.
Day 14 If still no engagement, graceful acceptance — a final message that respects their decision while leaving the door open: "We'll be here if you want to come back".

Journey 4: Win-Back (triggered by no purchase in 120 days for non-subscribers, or 60 days post-cancellation for subscribers). A 60-day sequence with declining frequency. The first touchpoint is the most important — if it doesn't land, subsequent emails have diminishing returns.

Day 0: "We miss you" with a specific callback to their last purchase and what's changed since (new products, improved formulations, seasonal offerings).
Day 14: Social proof from customers who came back — "Why (customer name) re-subscribed after a break".
Day 30: Significant re-engagement offer (this is the one place where a meaningful discount is justified — the alternative is losing the customer permanently).
Day 45: Final touchpoint — no sales pressure, just a "the door is always open" message.
Post-60 Days Move to dormant list, reduce email frequency to quarterly at most.

Journey 5: VIP Programme (triggered by Customer Health Score above 85 or lifetime spend above $500). Ongoing programme for the brand's most valuable customers.

• Exclusive early access to new products and limited editions.
• Founder AMAs or virtual tasting sessions (quarterly).
• Referral programme with meaningful rewards (not a 10% coupon — a free box or exclusive product).
• Feedback loop: VIP customers get direct input into product development decisions.
• Surprise and delight: unexpected gifts on purchase anniversaries, handwritten notes on milestone orders.

2.2 Intervention Playbooks

Beyond automated journeys, the customer success manager would create playbooks for manual intervention scenarios.

Scenario: Customer submits complaint:
• Within 2 hours: Acknowledge with empathy and ownership. Pause all marketing automation. • Within 24 hours: Provide solution or timeline. Offer appropriate compensation (replacement, refund, credit). • 7 - 14 days later: Follow up to confirm resolution. Gradually reintroduce appropriate content.

Scenario: High-value subscriber attempts cancellation:
• Immediately: Offer alternatives before processing (pause, skip, swap product, reduce frequency). • If they proceed: Process without friction (making cancellation difficult creates resentment, not loyalty) (Hypothetic... p. 9). Send a genuine exit survey. • 30 days post-cancellation: Begin win-back Journey 4 with personalised messaging.

Phase 3: Launch & Optimization (Weeks 9–12)

Weeks 9-10: Systems integration and tracking. API connections between Shopify, email platform, automation platform (Make.com or n8n), and CRM (HubSpot or equivalent). GA4 enhanced e-commerce configuration with custom events for lifecycle stage transitions, subscription events, and content engagement. Webhook-based real-time data synchronisation.

Weeks 11-12: Soft launch, testing, and training. All automations activated with close monitoring. Test customers run through each journey to verify trigger conditions, content delivery, and handoff logic. Team training on the Customer Health Score dashboard, intervention playbooks, and escalation procedures. Documentation delivered. Transition to ongoing Management Services.

Projected Outcomes These projections assumed Kava & Kin maintained its current customer acquisition rate, did not significantly alter its product line or pricing, and cooperated with the implementation timeline. We presented ranges because the outcomes depended on data quality, customer responsiveness, and execution consistency.

Customer Retention

Current 12-Month Conservative 12-Month Optimistic
Repeat purchase rate (2+ purchases) 23% 34-38% (+48-65%) 42-48% (+83-109%)
Average subscription duration 4.2 months 6.5-7.5 months (+55-79%) 8-10 months (+90-138%)
Subscription churn rate (monthly) ~18% 10-13% 7-9%
Active subscriber count 680 950-1,100 1,200-1,500

Basis for projection: The 23% repeat rate reflected zero post-purchase nurture. Industry benchmarks for consumable DTC brands with automated onboarding sequences showed repeat rates of 35-50%, depending on product quality and sequence effectiveness. The conservative range accounted for the possibility that a significant portion of one-time buyers were truly not the right fit for the product. Subscription duration improvements were based on the compounding effect of engagement scoring + proactive intervention + preference management — each individually contributed 1-2 months of retention extension.

What we did to make it lower: If Kava & Kin's product had a fundamental taste or efficacy barrier that no amount of education can overcome, the retention improvements would be modest. The data from Phase 1 would've revealed this — if return rates were high or NPS is below 40, the problem is product, not marketing infrastructure .

Customer Lifetime Value

Current 12-Month Conservative 12-Month Optimistic
Average CLV (all customers) $68 $100-$120 (+47-76%) $135-$175 (+99-157%)
Average CLV (subscribers) ~$124 $190-$225 (+53-82%) $260-$340 (+110-174%)
Average order value $37 $41-$45 (+11-22%) $47-$53 (+27-43%)
Revenue per customer per year ~$52 $72-$88 (+38-69%) $96-$125 (+85-140%)

Basis for projection: CLV improvement comes from three drivers: (1) more repeat purchases (retention),
(2) higher average order values (cross-sell and upsell through personalised journeys), and
(3) longer subscription durations. Each driver is independently supported by the system — the projections reflect their combined, compounding impact.
The wide range on optimistic subscriber CLV ($260-$340) reflects the exponential nature of retention improvement: each additional month of subscription adds linearly to CLV, but the probability of reaching that month increases non-linearly with effective engagement.

Revenue Impact

Current 12-Month Conservative 12-Month Optimistic
Monthly DTC revenue $97.5K $122K-$140K (+25-44%) $155K-$190K (+59-95%)
Revenue from reactivated customers $0 (no win-back) $4K-$8K/month $10K-$18K/month
Revenue from subscription growth ~$20K/month $28K-$34K/month $38K-$50K/month
Churn-prevented revenue (annualised) N/A $85K-$140K $165K-$260K

Basis for projection: Churn-prevented revenue is calculated as: (number of subscribers who would have cancelled under current conditions) × (additional months retained) × (average subscription value). At 680 subscribers with ~18% monthly churn, approximately 122 subscribers cancelled per month. Reduced churn to 10-13% prevented 34-55 cancellations per month. At $29.50/month per subscriber and an average of 3-5 additional months retained, the annualised value ranges from $85K to $260K. This was revenue that would have been lost — it didn't require new customer acquisition.

Acknowledged Limitations of The Projections

1. The 186% CLV increase and 287% retention improvement cited in our proposal are optimistic ceiling projections: The conservative floor was 47-76% CLV improvement and 48-65% retention improvement. Both are meaningful — but the spread between conservative and optimistic was wide because lifecycle optimisation outcomes depended heavily on data quality, product-market fit, and customer responsiveness.
2. Churn prediction models need calibration time: The churn model was not fully accurate at launch. It required 2-3 months of real-world prediction-versus-outcome comparison to calibrate properly. During that window, some at-risk customers were going to be missed, and some healthy customers were going to be incorrectly flagged. This is normal and expected — not a failure of the model.
3. Win-back success rates decline over time: A customer who churned 60 days ago had a meaningfully higher reactivation probability than one who churned 180 days ago. Our projections assumed the win-back infrastructure was deployed promptly after Phase 3, capturing recently churned customers while they were still reachable. Delay eroded the addressable win-back audience.
4. Subscription improvements require product-side flexibility: If the subscription platform didn't support pause, swap, frequency adjustment, or flexible SKU selection, the retention strategies were limited to communication-only interventions. We identified platform constraints during Phase 1 and recommended subscription platform migration if necessary (scoped separately).
5. This is the most expensive solution for a reason. The $20K infrastructure fee and $7K/month management fee reflect the depth of data work, model building, and multi-journey automation involved. For a brand with $1.8M in revenue, this is a significant investment. We believe the projected ROI justifies it — but we also believe in being transparent about the commitment required.

The Investment

Component Amount
Infrastructure fee (one time) $20,000 USD
Management Services (monthly) $7,000 USD/month (3-month minimum)
Performance bonus 35% of incremental revenue above baseline
Implementation timeline 12 weeks (Phases 1 - 3), then ongoing management

What the infrastructure fee covers: Everything described above — customer data audit and consolidation, RFM segmentation, churn prediction model development, Customer Health Score design, five automated lifecycle journeys, intervention playbooks, systems integration, analytics dashboard deployment, and team training.

What the Management Services fee covers: Churn model recalibration and threshold adjustment, Customer Health Score monitoring and intervention management, journey performance analysis and optimisation, weekly reporting with segment-level insights, monthly strategic review, and automation maintenance.

What it does not cover: Third-party software subscriptions (CRM, email platform, subscription management platform, analytics tools), customer service staffing, product changes or reformulations, data migration from legacy systems not accessible via API, and paid advertising. These are the Client's responsibility.

Why the 6-month management minimum: Unlike content marketing (3-month minimum) or lead generation (no mandatory management period), lifecycle optimisation requires extended model calibration, seasonal pattern recognition, and iterative journey refinement. Meaningful statistical significance on retention improvements requires at least 4-6 months of data. Cutting management services at month 3 means cutting before the system has proven itself.

Performance bonus structure: The 35% bonus is calculated on revenue above the agreed baseline - specifically on improvements in customer retention, repeat purchase rates, CLV growth, and reactivated churned customers. Revenue from new customer acquisition is excluded unless directly attributable to referral programmes built within the Infrastructure. The baseline methodology and attribution framework are agreed in writing during Phase 1 before any bonus calculations begin.

Why This Approach Works for Niche CPG:

Niche CPG brands can't rely on constant acquisition. The total addressable market for adaptogenic functional beverages is smaller than mass-market soft drinks. When you've reached 30-40% of your addressable audience through acquisition channels, growth has to come from making each customer more valuable - buying more frequently, for longer, across more of your product range.
Consumable products have natural repurchase cycles. Unlike a one-time purchase (furniture, electronics, etc.), beverages are consumed daily and need regular replenishment. This creates a predictable rhythm that automation can anticipate, support, and optimise. A customer who should reorder every 30 days but hasn't by day 35 is giving a clear signal; the system detects it and responds before day 60, when the customer has likely switched to a competitor or simply stopped using the product.
Subscription is the business model, but retention is the business. Kava & Kin's subscription cohort generates predictable monthly revenue - but only as long as subscribers stay. Improving subscription duration from 4.2 to 7.5 months doesn't sound dramatic, but it increases lifetime subscription revenue by 79% without acquiring a single new customer. At scale, this is transformative.
Data is the underused asset. Most niche CPG brands are sitting on 2+ years of transactional data, email engagement data, and customer service interactions that have never been consolidated, analysed, or acted upon. The lifecycle platform doesn't create new data - it unlocks the value of data that already exists.

Kava & Kin Customer Lifecycle Optimisation Platform
+48%%Customer Retention Rate
41%Repeat Purchase Ratio
3:1 (300%)Customer Lifetime Value
−68%CAC reduction
The mercantile methodology

How category leaders build infrastructure that compounds.

Most agencies sell you campaigns. We engineer systems — growth infrastructures that appreciate in value over time. Like premium real estate in emerging neighbourhoods, except the neighbourhood is your market category.

01

Foundation Intelligence

Weeks 1–4

We don't start with solutions. We start with understanding. Deep customer research. Competitive intelligence. Market positioning analysis. Every dollar you invest is set up to compound, not evaporate.

02

Infrastructure Engineering

Weeks 5–12

While others launch quick-win campaigns, we build systems. Behavioural tracking that learns. Content engines that scale. Conversion mechanisms that optimise themselves. This is where category leaders separate.

03

Performance Optimisation

Ongoing

Launch isn't the finish line — it's the starting gun. Continuous refinement based on data. A/B testing that reveals truth. Attribution modelling. Incremental improvements that create exponential results.

Our compensation is performance-aligned — we grow when you grow. No one succeeds unless your revenue increases above baseline.

World-class talent — strategists, designers, developers — without world-class hiring costs.

Infrastructure that you own, systems that you control. Permanently. Not rented. Yours.

Results : Testimonials

Driven by a performance mindset

"We went from $2.43M to $6.87M in 18 months and we own every system that made it happen. No platform lock-in, no ongoing agency dependency. The infrastructure runs itself."

Functional Beverage Brand Full infrastructure deployment — all three systems
183%Revenue growth
−52%CAC reduction
+411%Organic traffic

"We reclaimed 25 hours a week through the automation system. Grew our email list, we thought wouldn't grow, to 331%. LTV went from $87 to $264. No permanent hires. The infrastructure just works."

Organic Skincare Line Content Authority + Customer Lifecycle systems
Content output
+340%Email list
$264LTV vs $87
Why mercantile.artelier

Traditional marketing vs mercantile infrastructure

Traditional marketing mercantile infrastructure
Lead generation Random, campaign-dependent, unpredictable Systematic, intent-based, compounding over time
Content production Inconsistent, founder-dependent, burns out teams Automated authority engine, 8× output with no added headcount
Customer data Disconnected silos, no unified view 360° integrated intelligence, predictive lifetime value
Attribution Unknown or guessed, dollars lost in the dark Full attribution modelling across every touchpoint
Ownership Platform-dependent, revenue share, trapped 100% client-owned. No platform dependency, ever.
Results curve Campaigns depreciate. Stop spending, stop results. Infrastructure appreciates. Compounds every quarter.
Ready to build?

Complete the lead qualification form

Fill in the form and within 30 minutes we will map exactly what your brand needs — once you sign on the dotted line, we'll show you how to execute those needs.

What happens after you qualify

We map your current growth gaps and identify which strategy closes them fastest using the infrastructure that you chose

We show you exactly what infrastructure looks like for your brand category and revenue stage

You partner with us having a clear picture of what's possible — with or without us